Tập tin:Population and temperature.jpg
Từ Future Of Mankind
Kích thước hình xem trước: 800×498 điểm ảnh. Độ phân giải khác: 813×506 điểm ảnh.
Tập tin gốc (813×506 điểm ảnh, kích thước tập tin: 144 kB, kiểu MIME: image/jpeg)
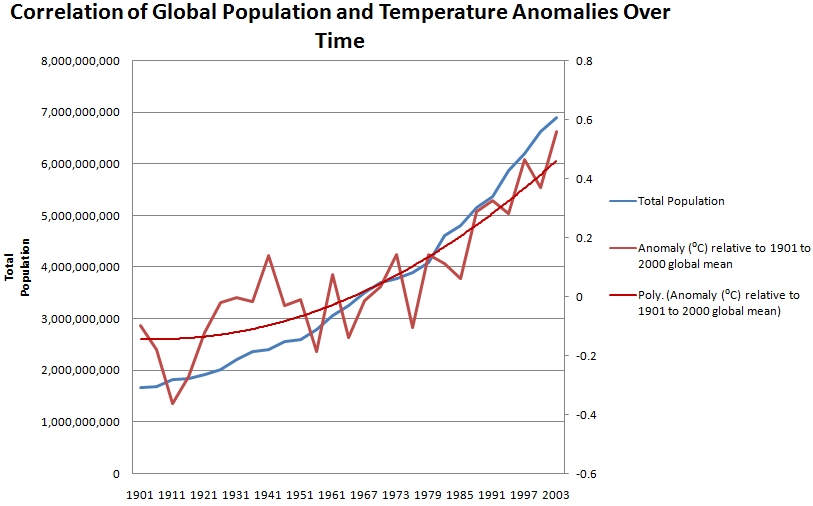
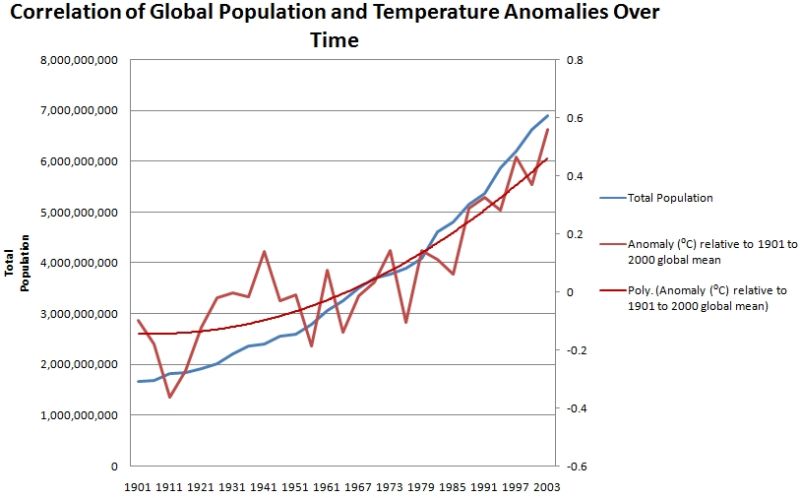
A graph showing the correlation between the rising human population of Earth and the global temperature difference to that of the 1901 to 2000 mean temperature.
Human population data courtesy Ptaah. See Overpopulation_Crusade#Earth_Population_Growth_Chart.
Temperature data courtesy National Climatic Data Center (NCDC), U.S. Dept of Commerce. http://www.ncdc.noaa.gov/oa/climate/research/anomalies/index.php
Lịch sử tập tin
Nhấn vào ngày/giờ để xem nội dung tập tin tại thời điểm đó.
| Ngày/Giờ | Hình xem trước | Kích cỡ | Thành viên | Miêu tả | |
|---|---|---|---|---|---|
| hiện tại | 04:55, ngày 10 tháng 7 năm 2009 | | 813×506 (144 kB) | Jamesm (thảo luận | đóng góp) | A graph showing the correlation between the rising human population of Earth and the global temperature difference to that of the 1901 to 2000 mean temperature. Human population data courtesy Ptaah. See [[Overpopulation_Crusade#Earth_Population_Growt |
Bạn không được phép ghi đè tập tin này.
Trang sử dụng tập tin
Không có trang nào sử dụng tập tin này.